Monitoring with grafana and prometheus
Intro
Monitoring a server is helpful in order to keep it running. To see, how much resources are used, whether there are any problems on the road and so on. And it also gives you nice charts.
We’ll use two tools here: Grafana, which is used to draw the charts and to configure a dashboard. And Prometheus, which collects metrics and acts as a data source for grafana.
Install grafana
There is already good documentation available: Getting started with Grafana and Prometheus and Install on Debian or Ubuntu. I’ll provide here only the short form.
First step is, to install the software:
sudo apt-get install -y apt-transport-https
sudo apt-get install -y software-properties-common wget
wget -q -O - https://packages.grafana.com/gpg.key | sudo apt-key add -
echo "deb https://packages.grafana.com/oss/deb stable main" | sudo tee -a /etc/apt/sources.list.d/grafana.list
sudo apt-get update
sudo apt-get install grafana
And then start grafana:
sudo systemctl daemon-reload
sudo systemctl start grafana-server
sudo systemctl status grafana-server
sudo systemctl enable grafana-server.service # start at boot
Then, grafana is available at tcp port 3000, so you can access it at http://your.server.example.com:3000.
Login as “admin” with the default password “admin” and change it now.
If you use a firewall, you’ll need to open the port 3000, e.g. sudo ufw allow 3000/tcp.
Install prometheus
Prometheus is already available in the default Debian repository, so you can simply install it:
sudo apt install prometheus prometheus-node-exporter
This will install prometheus itself, which we’ll add as a data source to grafana. Prometheus runs on localhost at port 9090. It will also install the node-exporter, which provides metrics on the current node (like cpu load, network traffic stats and so on).
Connect prometheus with grafana in the grafana web ui by adding a new data source: Explorer ➡️ Add Data Source ➡️ Prometheus: http://localhost:9090
For prometheus, no firewall ports will be opened. The port 9090 only needs to be access locally by grafana. It would be different, if grafana runs on a different host, but not in this simple setup.
Monitoring Jamulus
The main goal, why I set this up, was to monitor my Jamulus instance (see last post Installing Jamulus). Since Jamulus doesn’t offer a metrics endpoint, that could be used directly by prometheus or grafana, we’ll use mtail to read logfiles and create metrics.
First, install mtail:
sudo apt install mtail
Then, we’ll have a look at the logfile, that Jamulus produces, when someone is connecting and when all users are disconnected again. The logfile is /var/log/daemon.log (actually systemd makes sure, that Jamulus’ logs appear there). The first line is the connected message, the second line appears, when all users are disconnected:
Jan 22 09:25:30 vserver12345678901 jamulus[9571]: 2021-01-22 09:25:30, 1.2.3.4, connected (1)
Jan 22 09:26:43 vserver12345678901 jamulus[9571]: 2021-01-22 09:26:43,, server idling -------------------------------------
We’ll create a small script for mtail as /etc/mtail/jamulus.mtail, which will read this file and parse the two lines:
# Syslog decorator
def syslog {
  /^(?P<date>(?P<legacy_date>\w+\s+\d+\s+\d+:\d+:\d+)|(?P<rfc3339_date>\d{4}-\d{2}-\d{2}T\d{2}:\d{2}:\d{2}.\d+[+-]\d{2}:\d{2}))/ +
  /\s+(?:\w+@)?(?P<hostname>[\w\.-]+)\s+(?P<application>[\w\.-]+)(?:\[(?P<pid>\d+)\])?:\s+(?P<message>.*)/ {
    len($legacy_date) > 0 {
      strptime($2, "Jan _2 15:04:05")
    }
    len($rfc3339_date) > 0 {
      strptime($rfc3339_date, "2006-01-02T03:04:05-0700")
    }
    next
  }
}

@syslog {
    gauge jamulus_clients

    /jamulus\[/ {
        /connected/ {
            jamulus_clients++
        }
        /server idling/ {
            jamulus_clients = 0
        }
    }
}
Next, we’ll need to enable mtail and configure the logfile. Edit the file /etc/default/mtail:
ENABLED=yes
LOGS=/var/log/daemon.log
And start mtail:
sudo systemctl enable mtail
sudo systemctl restart mtail
sudo systemctl status mtail
Now mtail is running on localhost at port 3903. You can check the metrics with curl:
$ curl localhost:3903/json
[
  {
    "Name": "jamulus_clients",
    "Program": "jamulus.mtail",
    "Kind": 2,
    "Type": 0,
    "LabelValues": [
      {
        "Value": {
          "Value": 0,
          "Time": 1612468581000000000
        }
      }
    ]
  }
]
Prometheus will actually use a different format, that is available as localhost:3903/metrics:
$ curl localhost:3903/metrics
# TYPE jamulus_clients gauge
Prometheus doesn’t use this new source yet, so we’ll need to add a new “scrape_config” in the file /etc/prometheus/prometheus.yml:
- job_name: mtail
  static_configs:
    - targets: ['localhost:3903']
After you have restarted prometheus (sudo systemctl restart prometheus), you should be able
to create a new chart in grafana selecting the metric “jamulus_clients”.
Maybe improved Jamulus Client counter
The described approach has a problem: If a user disconnects, there is no log and the counter does not decrement. As you can see in the mtail script, the “jamulus_clients” gauge is only incremented or reset to 0. This might give sometimes two high numbers of jumulus clients.
In order to fix this, we’ll start Jamulus with the option --htmlstatus. This will create a HTML status
page with the currently connected clients (see Jamulus Command Line Options).
We just need to count the line numbers, that’s all.
-
Create a directory, where Jamulus can create the status file:
sudo mkdir /run/jamulus sudo chown jamulus /run/jamulus
-
Change
/etc/systemd/system/jamulus.serviceto contain the following command line for starting Jamulus:ExecStart=/usr/local/bin/Jamulus –server –nogui –port 22124 –numchannels 40 –norecord –htmlstatus /run/jamulus/jamulus-status.html
-
Reload systemd and restart Jamulus
sudo systemctl daemon-reload sudo systemctl restart jamulus.service
-
Create a new file
/etc/mtail/jamulus-status.mtail:
getfilename() !~ /jamulus-status.html/ {
  stop
}

gauge jamulus_clients_status

/No client connected/ {
    jamulus_clients_status = 0
}

/<\/li>/ {
    jamulus_clients_status++
}
- Update the file
/etc/default/mtail:
ENABLED=yes
LOGS=/var/log/daemon.log,/run/jamulus/jamulus-status.html
- Restart mtail:
sudo systemctl restart mtail
This unfortunately also doesn’t work perfectly, since mtail tails the file since it is for log file, where new logs are just appended to the end. But Jamulus rewrites the whole file, so on every file change, mtail would need to re-read the whole file.
Dashboard example
To get started with a dashboard, you can use Node Exporter Full, which nicely shows the metrics of the prometheus node exporter.
I’ve just added new graphs for Jamulus:
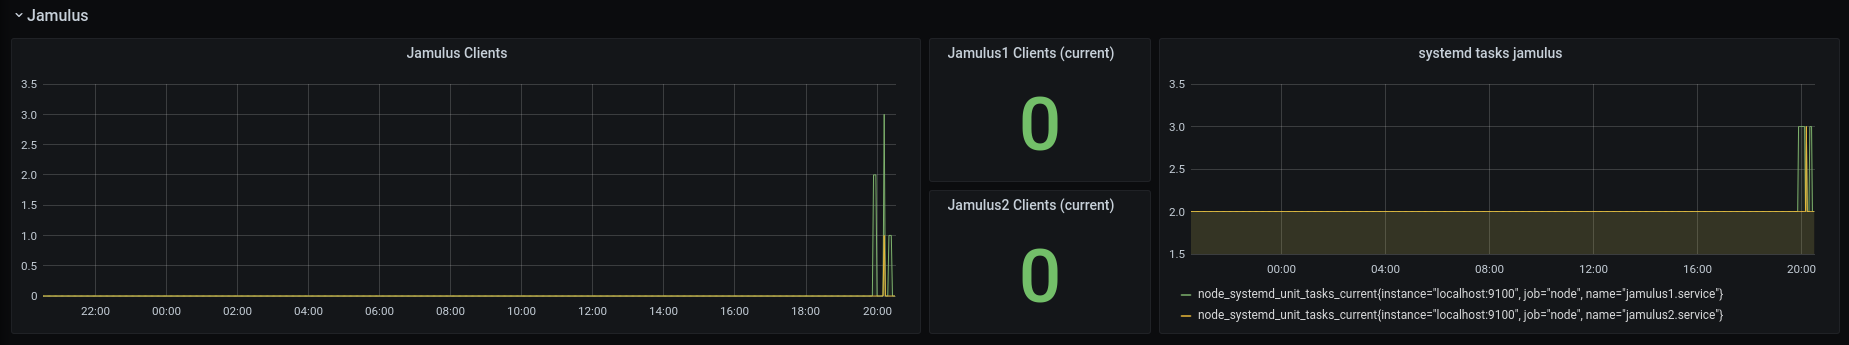
Note, that I’m running two Jamulus instances. I’ve used the following metrics:
- for the graph on the left “Jamulus Clients”: jamulus_clients_status
- for the counter “Jamulus1 Clients (current)”: jamulus_clients_status{prog=”jamulus1-status.mtail”}
- for “systemd tasks jamulus”: node_systemd_unit_tasks_current{name=”jamulus1.service”}
Further TODOs
What missing:
-
Configure proper authentication. If you want to give access to somebody else, you should add more users. Currently I just use the admin user.
-
HTTPS. Grafana is exposed unencrypted, which means, that the admin password is transmitted unencrypted as well.
References
- https://grafana.com/
- https://prometheus.io/
- https://grafana.com/docs/grafana/latest/getting-started/getting-started-prometheus/
- https://grafana.com/docs/grafana/latest/installation/debian/
- https://github.com/google/mtail
- https://jamulus.io/wiki/Command-Line-Options
- https://grafana.com/grafana/dashboards/1860
Comments
No comments yet.Leave a comment
Your email address will not be published. Required fields are marked *. All comments are held for moderation to avoid spam and abuse.